Vancouver Airbnb Market Analysis — SQL + Tableau
End-to-end data analytics workflow for Vancouver Airbnb listing data: raw CSV ingestion and SQLite storage, SQL-based aggregation and export, and an interactive Tableau dashboard for pricing, neighbourhood, and room-type insights using the Inside Airbnb Vancouver dataset.
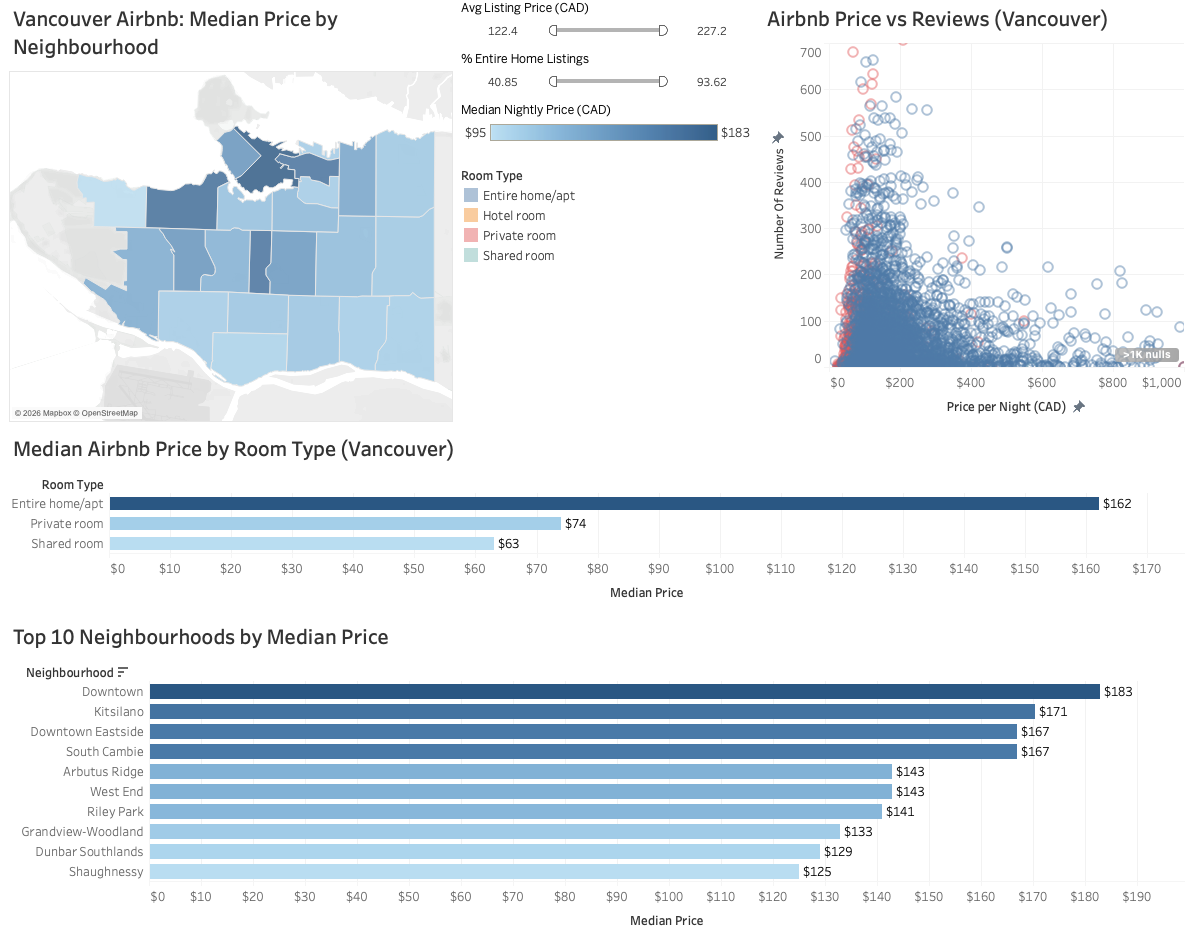
Preview
Problem & Context
The goal was to load and clean Airbnb listing and review data into a SQLite database, answer business questions using SQL (neighbourhood-level metrics, room-type summaries), export results to CSV for Tableau, and build an interactive dashboard. The project simulates a real-world data analyst task where stakeholders need clear, visual answers about market performance and pricing patterns.
What It Does
- Structured data pipeline — Raw CSVs → Python ETL → SQLite with price cleaning and date handling
- SQL-first analytics — Reusable queries for median prices (window functions), averages, counts; NULL and outlier filters ($20–$1000)
- Neighbourhood summary — Listing count, avg/median price, avg reviews, % entire home/apt, availability
- Room type summary — Count, avg and median price by Entire home/apt, Private room, Shared room
- Interactive Tableau dashboard — Choropleth map by neighbourhood, scatter (price vs reviews), bar charts by room type and top neighbourhoods; filters for price and room type
- Exploratory notebook — Jupyter EDA for sanity checks and dashboard design
Tech Stack
Key Takeaways
Clean separation of ETL (Python), analytics (SQL), and visualization (Tableau) makes the workflow reproducible and easy to extend. The dashboard communicates pricing and neighbourhood insights at a glance and is published on Tableau Public for sharing.