Public Transit Delay — Exploratory Data Analysis
Structured exploratory data analysis of public transit delay data: cleaning raw delay data, engineering features (time-based, delay categories), and producing clear visualizations and insights to understand when, where, and how delays occur. Two Jupyter notebooks (cleaning + EDA) with key findings on distribution, temporal patterns, route-level performance, and on-time rates.
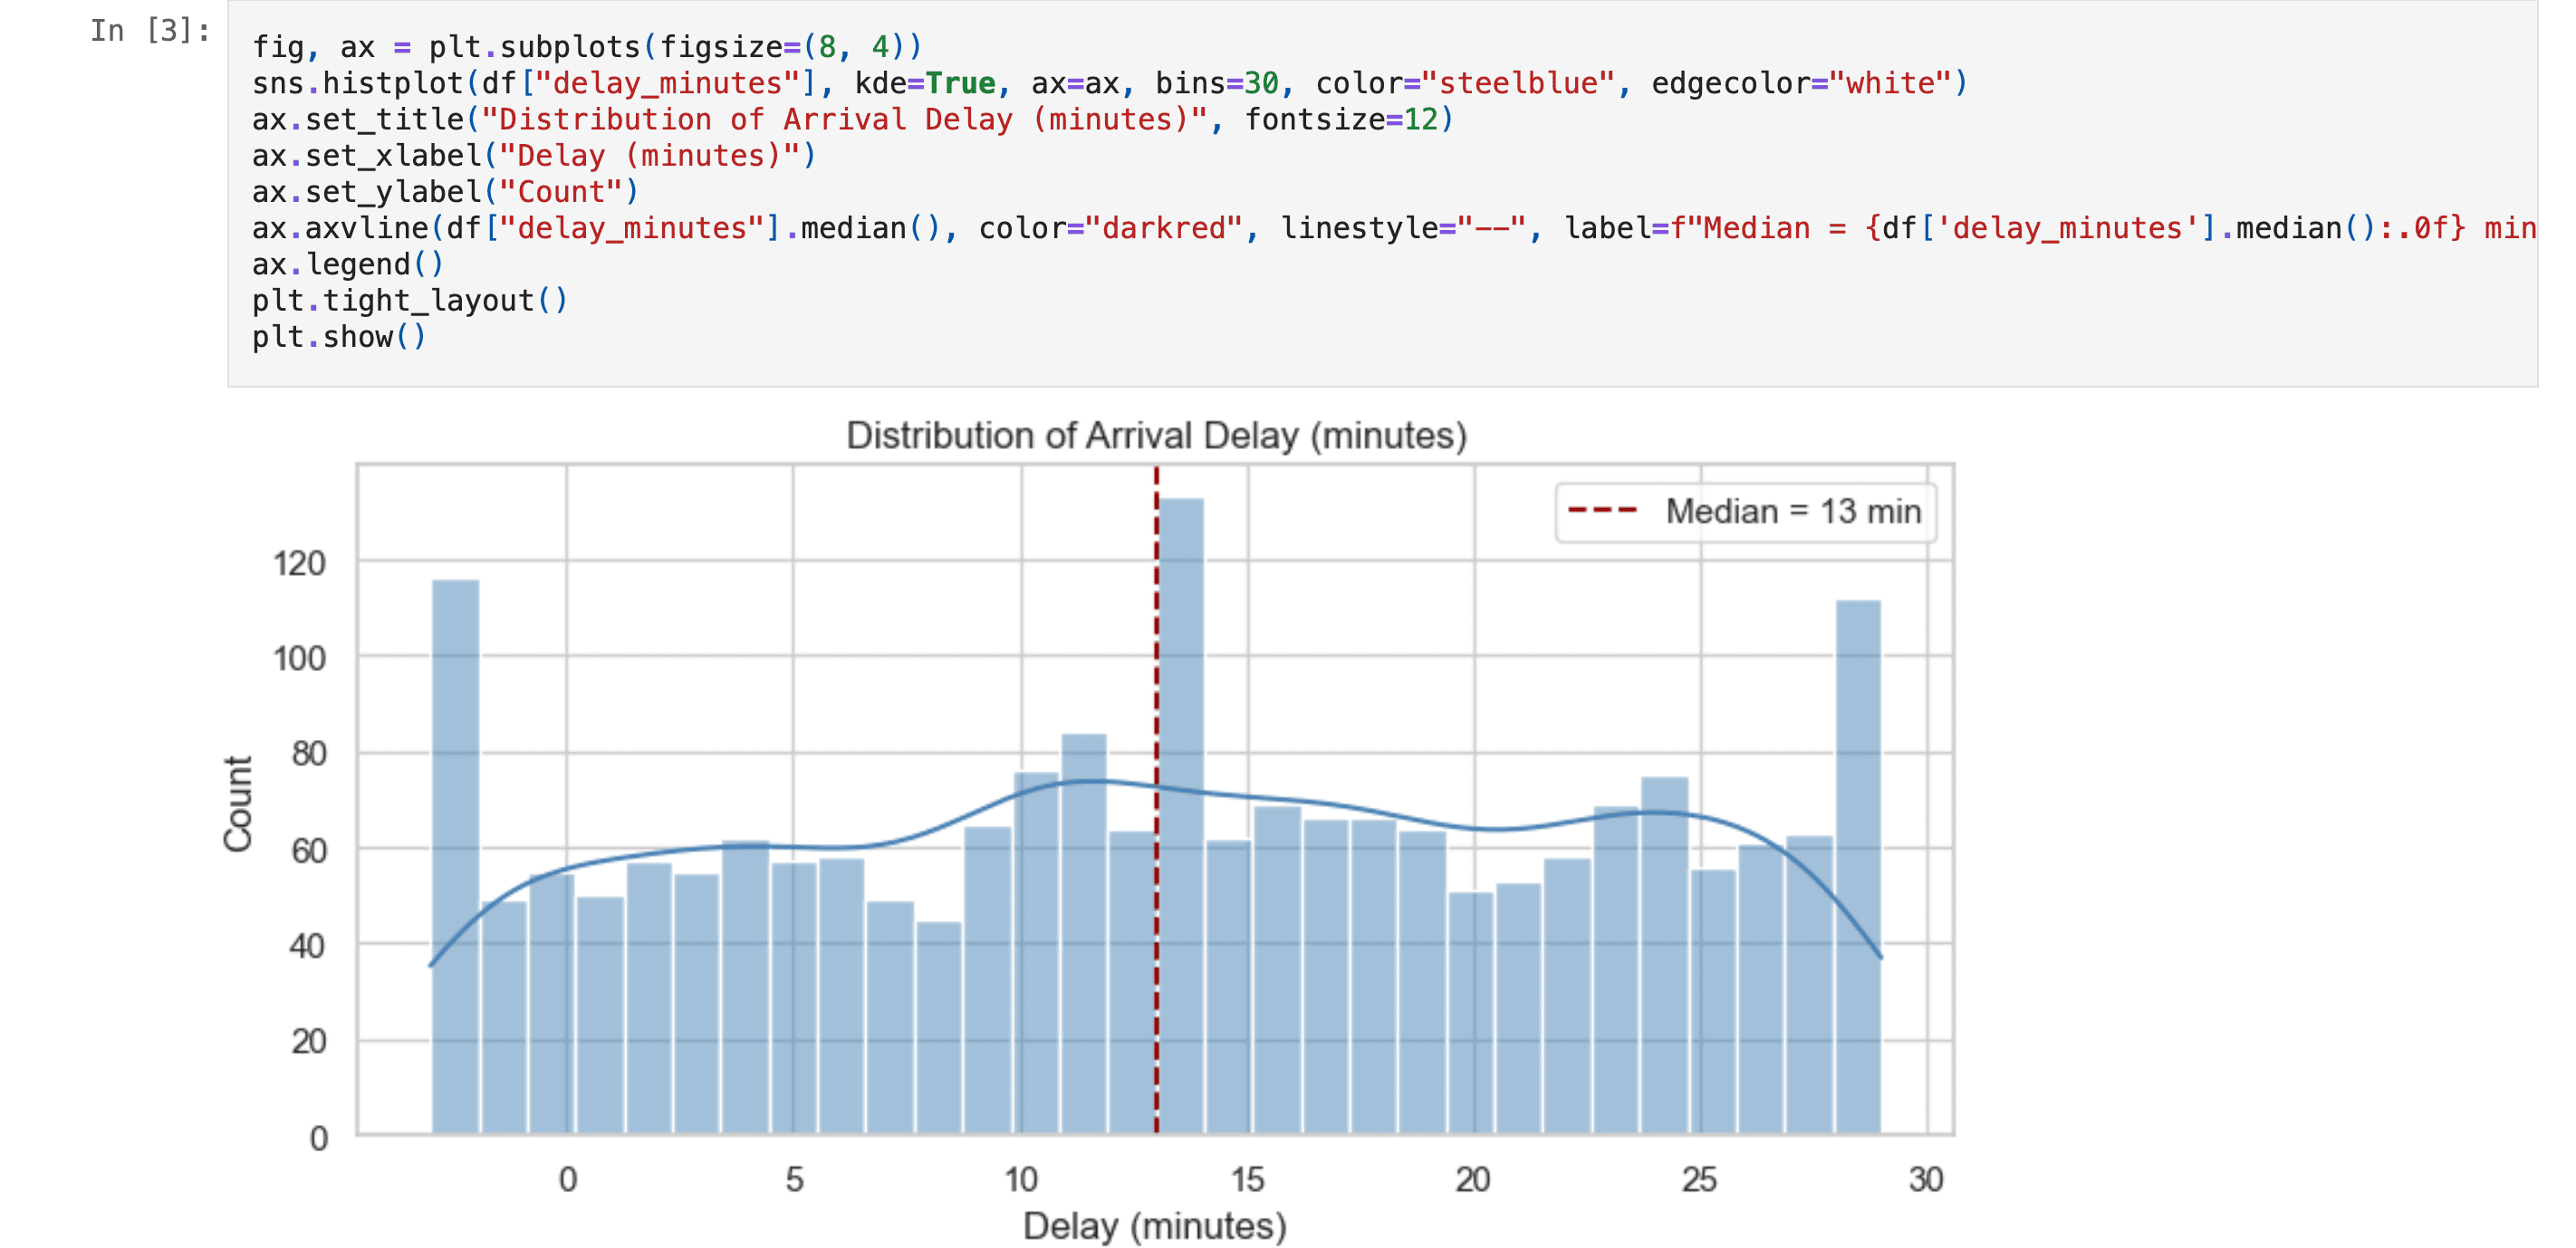
Preview
Problem & Context
The goal was to load and clean raw public transit delay data, document data quality issues (missing values, types, outliers), engineer features for analysis and future modeling, explore the cleaned dataset through well-labeled visualizations, and summarize key findings in a reproducible way. The dataset (Kaggle: Public Transport Delays with Weather and Events) covers trip-level records with scheduled/actual times, delay minutes, route, weather, and congestion.
What It Does
- Data cleaning — Missing values, types, duplicates and invalid entries; save cleaned output to
data/processed/ - Feature engineering — Time-based and delay-related features for EDA and modeling
- Exploratory analysis — 4–6 well-labeled plots with short insights (notebook 02_eda)
- Key findings — Median delay ~13 min; Route_12, Route_18, Route_15 highest mean delays; ~25% on time, ~75% delayed; weak correlation with congestion and precipitation
Tech Stack
Key Takeaways
A clean two-notebook workflow (cleaning → EDA) keeps the analysis reproducible and portfolio-ready. The findings support operational focus on high-delay routes and inform future modeling (e.g. regression or classification on delay).